打造全栈排查利器:用 Grafana Loki 优雅降维打击多机日志管理
5分钟告别传统 SSH 黑框,教你搭建极轻量、纯网页端的自动化日志监控平台。
为了确保最高的稳定性和极低的资源消耗,遵循 Grafana 官方推荐的单机二进制(Binary)部署指导(比 Docker 性能更好、更直观)。
目标:在已有granfana平台的基础 上部署Loki,并监控服务器的相关日志
前提:开放Loki端3000,3100端口
准备工作:创建统一目录
# mkdir -p /opt/loki-stack
# cd /opt/loki-stack
第一步:服务端机器下载并安装 Loki
Loki 官方提供编译好的单文件二进制包,直接下载解压即可运行。
1.下载官方二进制包与默认配置:
# 下载 Loki 主程序
wget https://github.com/grafana/loki/releases/download/v3.0.0/loki-linux-amd64.zip
#或者使用国内GitHub镜像下载Loki主程序
wget https://ghfast.top/https://github.com/grafana/loki/releases/download/v3.0.0/loki-linux-amd64.zip
# 解压
unzip loki-linux-amd64.zip
mv loki-linux-amd64 loki

# 下载官方标准配置文件
wget https://raw.githubusercontent.com/grafana/loki/main/cmd/loki/loki-local-config.yaml -O loki-config.yaml
#或者使用ghfast.top代理下载
#wget https://ghfast.top/https://raw.githubusercontent.com/grafana/loki/main/cmd/loki/loki-local-config.yaml -O loki-config.yaml2.清空原来的配置文件以添加“自动清理策略”(防止撑爆磁盘): 打开 loki-config.yaml,在文件末尾添加以下内容:
auth_enabled: false

server:
  http_listen_port: 3100
  grpc_listen_port: 9096

common:
  instance_addr: 127.0.0.1
  path_prefix: /tmp/loki
  storage:
    filesystem:
      chunks_directory: /tmp/loki/chunks
      rules_directory: /tmp/loki/rules
  replication_factor: 1
  ring:
    kvstore:
      store: inmemory

schema_config:
  configs:
    - from: 2024-01-01
      store: tsdb
      object_store: filesystem
      schema: v13
      index:
        prefix: index_
        period: 24h

limits_config:
  retention_period: 168h #地保留7天日志,绝不重复

compactor:
  working_directory: /tmp/loki/retention
  compaction_interval: 10m
  retention_enabled: true
  delete_request_store: filesystem # 解决元数据存放问题
3.使用 Systemd 保持后台运行: 创建系统服务文件 vi /etc/systemd/system/loki.service:
[Unit]
Description=Grafana Loki Log Aggregator
After=network.target

[Service]
Type=simple
ExecStart=/opt/loki-stack/loki -config.file=/opt/loki-stack/loki-config.yaml
Restart=on-failure

[Install]
WantedBy=multi-user.target
启动 Loki:
systemctl daemon-reload
systemctl enable loki --now
# 检查状态,看到 active (running) 即成功
systemctl status loki
第二步:目标机器下载并配置 Promtail (收集端)
Promtail 需要在日志收集端部署。
1.规范创建所有必要目录
# 创建 Promtail 程序及配置目录
mkdir -p /opt/loki-stack/promtail

# 创建你要监控的 FastAPI 日志存放目录(如果研发还没创建的话)
mkdir -p /var/log/fastapi
2. 下载并解压主程序
进入刚刚创建好的工作目录,下载官方二进制包:
cd /opt/loki-stack/promtail

# 下载官方 v3.0.0 二进制包
wget https://github.com/grafana/loki/releases/download/v3.0.0/promtail-linux-amd64.zip

# 或者使用 ghproxy 代理加速下载
wget https://ghfast.top/https://github.com/grafana/loki/releases/download/v3.0.0/promtail-linux-amd64.zip

# 解压(若提示找不到命令,请先执行 yum install unzip -y)
unzip promtail-linux-amd64.zip

# 将解压出来的文件重命名,方便后续调用
mv promtail-linux-amd64 promtail

# 清理无用的压缩包
rm -f promtail-linux-amd64.zip
3. 创建配置文件
在当前目录下创建配置文件:vi /opt/loki-stack/promtail/promtail-config.yaml,写入官方标准模板:
positions: {}
server:
  http_listen_port: 9080
  grpc_listen_port: 0

positions:
  filename: /opt/loki-stack/promtail/positions.yaml

clients:
  - url: http://10.1.0.14:3100/loki/api/v1/push

scrape_configs:
  - job_name: fastapi-cluster
    static_configs:
      - targets:
          - localhost
        labels:
          job: fastapi
          host: api
          __path__: /home/ubuntu/api/nohup.out  #需要监控的日志文件

  - job_name: fastapi-app-logs
    static_configs:
      - targets:
          - localhost
        labels:
          job: fastapi
          host: api
          __path__: /home/ubuntu/api/log/app.log*  #需要监控的日志文件
保存退出
配置Systemd服务文件
vi /etc/systemd/system/promtail.service直接把下面的标准配置贴进去:
[Unit]
Description=Promtail Log Client
After=network.target

[Service]
Type=simple
# 👈 使用绝对路径,确保后台能正确拉起程序和读到配置文件
ExecStart=/opt/loki-stack/promtail/promtail -config.file=/opt/loki-stack/promtail/promtail-config.yaml
Restart=on-failure

[Install]
WantedBy=multi-user.target
2. 重新加载并一键启动
保存退出后(:wq),依次执行以下命令让系统识别新服务并运行:
# 1. 刷新后台
systemctl daemon-reload

# 2. 设置开机自启,并现在立刻启动它
systemctl enable promtail --now

# 3. 检查状态
systemctl status promtail
直接拉起Promtail服务
systemctl restart promtail
systemctl status promtail
安装grafana
# 1. 通过代理地址下载 Grafana 官方商业版/开源版安装包
wget https://mirrors.tuna.tsinghua.edu.cn/grafana/apt/pool/main/g/grafana/grafana_10.4.1_amd64.deb

# 2. 使用 dpkg 强制安装
sudo dpkg -i grafana_10.4.1_amd64.deb

# 3. 设置开机自启并现在立刻启动
sudo systemctl daemon-reload
sudo systemctl enable grafana-server --now

# 4. 清理安装包
rm -f grafana_10.4.1_amd64.deb
访问 granfana http://ip:3000
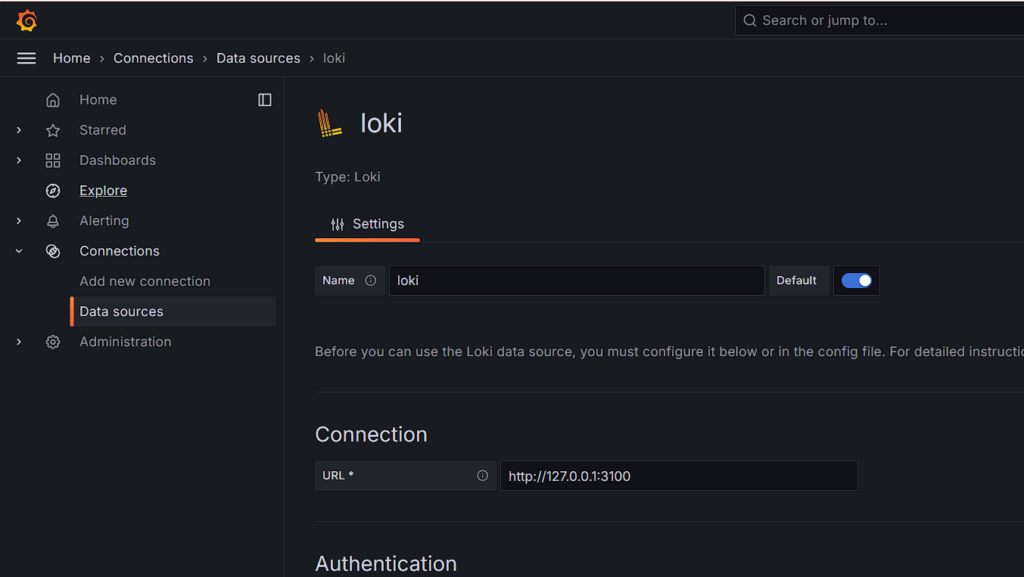
添加 Loki 数据源
进入主界面后:
- 点击左侧菜单栏的 Connections(连接图标),然后选择 Data sources(数据源)。
- 点击右上角的蓝色按钮 Add data source。
- 在搜索框中输入
Loki,看到 Loki 图标后点击它进入配置页面。
第三步:填写连接地址
在 Loki 配置表单中,你只需要填写一个地方:
- 找到 URL 输入框,因为 Loki 和 Grafana 都在这同一台机器上,直接输入本地回环地址即可:
2回到Explore的 Run query 按钮。
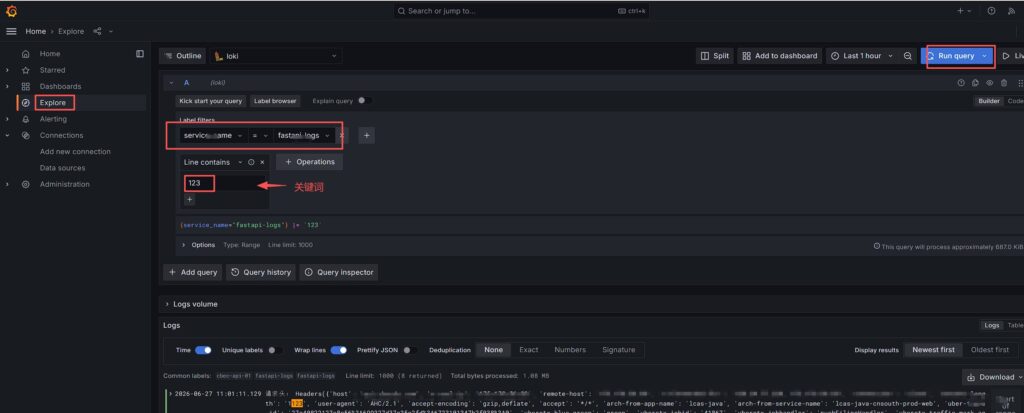
现在你就可以在屏幕下方尽情翻阅、搜索和过滤这 500M 历史日志以及动态更新的 FastAPI 实时数据了!看看有没有成功刷出来?
🔍 验收
服务启动后,你可以静静等待一会。此时 Promtail 已经在后台把日志数据倒腾给 Loki 了。
接下来你就可以登录 http://ip:3000,在 Explore 里面选择 Loki 数据源,通过 {host="api"} 语法,翻阅配置的日志,再也不需要频繁登录服务器了。